Analysis & Reports
TracePro provides a comprehensive set of tools to view and analyze the results of aray trace simulation, including:
- Irradiance/Illuminance Maps show irradiance, CIE xy or u’v’, and true color maps of light incident on, absorbed by, or exiting a selected surface. Multiple options are available to control pixel count, profiles, relief plotting, linear and logarithmic output, gradient, color maps, and smoothing as well as exporting results to a text file or a bitmap file for later viewing.
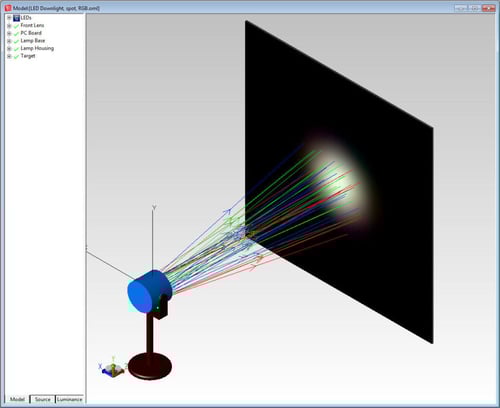
LED lamp with true color output plot shown on target
- Candela Plots are plots of luminous intensity, or flux per solid angle. In photometric units, a luminous intensity plot is in units of candelas, or lumens per steradian. In radiometric units, the corresponding quantity is called intensity and has units of watt/steradian. Candela plots are commonly used in the design of illumination systems. Several Candela Plots may be displayed from the ray trace data. Depending on your selections in the Candela Options dialog box, TracePro considers incident rays, exiting rays, or flux that misses all the model geometry during the ray trace as Candela data. The candela plots present flux versus angle and can be smoothed using the Candela Options dialog box. The iso-candela plots can be presented as false color maps or contour plots. The distribution plots are graphs of cross-sectional curves through the candela distribution.
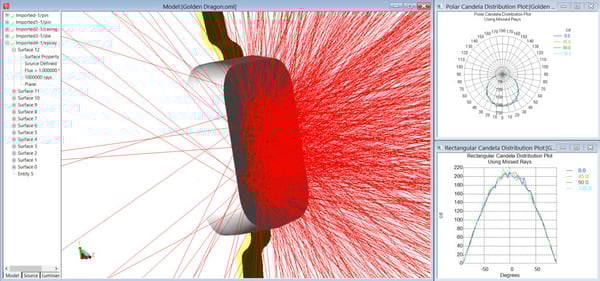
Osram LED shown with rays traced and candela plots
- Luminance/Radiance Maps can be displayed as true color based on the wavelengths traced. Luminance Maps can be used to make very accurate photorealistic renderings using the optical properties and sources applied to the model. 3D Irradiance Plots map irradiance, CIE and true color plots of the incident, absorbed or exiting flux onto the selected surfaces or objects
in the system view. This mapping is achieved by layering the light map of the displayed flux or color output on top of the 3D CAD geometry.
Multiple options are available for contour plotting, transparency, ambient lighting, linear and logarithmic output, gradient shading, color maps, and smoothing. Candela Plots show luminous or radiant intensity in candelas or watts/steradian. There are four types of candela plots, Polar Candela and Iso-Candela, Rectangular Candela and Iso-Candela. - Polarization Maps chart the polarization ellipse for the incident flux onto the selected surface. Color levels and ellipses graphically display the degree of polarization and ellipticity at points on the surface.
- Incident Ray Tables provide a tabular output of rays incident on a
selected surface. - Ray History Tables create a complete history of every surface intersection along the path of the ray, for each ray incident on a selected surface.
- Path Sorting Tables create a sortable table of every non-sequential ray path incident on a selected surface, with interactive breakout and visualization
of each ray path, and irradiance maps of selected paths. - Optical Path Length (OPL) or Time-of-Flight Plots present flux absorbed
or incident on a selected surface versus OPL for specialized analyses. - Volume Flux Maps visualize the flux absorbed, incident, lost,
or emitted throughout a rectangular volume.
Map and plot output can be further controlled with Ray Sorting. For example, analysis results can be filtered to show only the rays intersecting a surface,
rays of a certain wavelength, interaction type, or flux range.
TracePro can generate a variety of ray-trace and property reports, including:
- Ray Sorting, Tracing, Histories
- Flux
- Path Sorting
- Irradiance/Illuminance
- 3D Irradiance/Illuminance
- Radiance/Luminance
- Candela
- Incident Ray Table
- OPL/Time of Flight