TracePro Product Information
Illumination systems are designed using TracePro by iterating through small changes in the geometry or properties. Often this optimization is done manually, but the 3D Optimizer can do it automatically. In either case, the following steps are required:
- Lay out the physical geometry, set optical properties, specify location and orientation
- Define optical sources as grid sources, surface sources or ray files
- Trace rays to calculate illumination distributions throughout the system
- Optimize
- Analyze results
- Generate reports
Solid Modeling
You can create TracePro models by importing lens design or CAD files, or by directly creating solid geometry. Using TracePro’s user-friendly, 3D CAD interface you can:
- Modify imported or built geometry
- Move, rotate, and scale solid objects
- Sweep and revolve surfaces
- Add primitive solids (tubes, blocks, cones, and spheres)
- Create optical elements (lens elements, reflectors, and Fresnel lenses)
Use the Interactive Optimizer to:
- Interactively sketch 2D and 3D profiles
- Extrude, revolve, and combine these profiles to create sophisticated geometry like light pipes, biconic reflectors, and free-form optics
Once you have created a model, visualize it using solid rendering, silhouette view, wireframe, hidden line view, and pan, rotate, and zoom the viewing window.
Light Sources
TracePro simulates the distribution of light by tracing rays using the Monte Carlo method. Model sources by emitting rays. Use the Surface Source Property Generator to digitize angular and spectral information directly from a manufacturer’s datasheet.
You can define sources using any of three methods:
- Grid
- Spatial and angular beam profile, weighting, and dimensions
- Ray pattern
- Beam orientation
- Polarization state and degree of polarization
- Surface
- Angular distribution
- Spectral distribution
- Flux or irradiance/illuminance
- Blackbody or graybody via temperature and emissivity
- Ray File, either text or binary. Each ray is specified by:
- Starting positions and directions
- Wavelength
- Flux or Stokes vector
- Degree of Polarization
Ray files are most often created from measurements.
Optimization
TracePro offers powerful 3D optimization with complete and interactive control of design parameters.
Optical Properties
Many material and surface properties are available to apply to objects and surfaces in the model. Object properties include:
- Material property (versus temperature and wavelength)
- index of refraction
- bulk absorption coefficient
- birefringence data
- Bulk scatter property (versus wavelength)
- scatter coefficient
- phase function parameters
- Fluorescence property (versus temperature)
- Absorption spectrum
- Excitation spectrum
- Emission spectrum
- Gradient Index (versus wavelength)
- Coefficients of gradient index formulas
- Temperature
- Mueller matrix
- Standard polarization elements
- Direct input of matrix values
Surface properties include:
- Surface property (versus temperature, wavelength, and incident direction)
- Specular reflectance and transmittance coefficients
- Absorptance
- Scatter
- Grating parameters
- Polarization data
- Stack (single- or multi-layer optical coatings)
- BSDF (BRDF and BTDF versus temperature, wavelength, and incident direction)
- ABg
- Elliptical Gaussian
- Elliptical ABg
- Symmetric table
- Asymmetric table
- 1D ABg
- 1D table
- Combinations of the above
- Temperature
- Uniform
- Distribution (table or polynomial)
- Aperture diffraction
- Source
- RepTile™
- Repetitive microstructure on engineered diffusers
Most properties are stored in a database for repeated use. Define custom properties or choose from a database of commercially-available materials and coatings.
Ray Tracing
The TracePro ray tracing engine is known for high performance and accuracy. Results from TracePro simulations have been verified many times by our customers. See the Literature page for some examples. The color of displayed rays can be customized:
- Ray color display
- By flux
- By wavelength
- By source
Analysis
TracePro’s comprehensive set of tools to view and analyze results of the ray-trace includes:
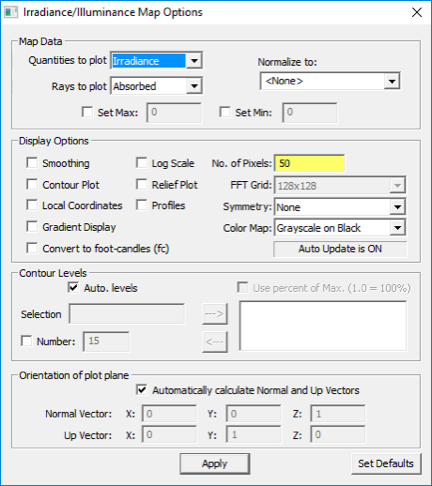
- Irradiance/illuminance maps
- Luminance/Radiance Maps can be displayed for multiple eye positions. You can also create a photorealistic rendering using the optical properties and sources applied to the model.
- Photorealistic rendering quickly gives an estimate of the appearance of your system.
- 3-D Irradiance/illuminance plots map the incident or absorbed flux on surfaces or objects, displayed directly on the 3D CAD geometry.
- Candela plots show luminous or radiant intensity in candela or Watt/steradian.
- Polarization maps chart the polarization ellipse for the incident or absorbed flux on a surface. Color levels and ellipses graphically display the degree of polarization and ellipicity over the surface.
- Incident Ray Tables provide tabular output of every ray incident on a selected surface.
- Ray History Tables display the complete history of every ray incident on a surface.
- Path Sorting Tables display a sortable table of ray paths incident on a selected surface, with interactive viewing of rays and irradiance maps. Refine the table using Filtering.
Map and plot output can be controlled with Ray Sorting. Analysis results can be filtered to show only the rays intersecting a surface, rays of a certain wavelength, interaction type, or flux range.
Reporting
TracePro can generate several ray trace and property reports.
- Flux Report provides surface area, number of incident rays, incident, absorbed, and lost flux. Bulk absorption and incident flux for each object is included.
- Property Report summarizes the model’s property data.
- Raytrace Report displays elapsed ray trace time.